In this article, I will examine the top charts used by traders and investors. Opting for the best charts is crucial for analyzing and tracking the price’s ups and downs. From novice to expert investor, I will highlight the best charts that offer quality, instant updates, and effective trading tools.
Key Points & Best Crypto Charts To Use
| Platform | Key Points / Features |
|---|---|
| TradingView | Advanced charting tools, custom indicators, social trading community, multi-asset support, real-time market data. |
| Coinigy | Unified crypto trading across exchanges, portfolio management, alerts, API integration, multi-exchange charting. |
| CryptoCompare Charts | Price charts, historical data, portfolio tracking, crypto market overview, comparison of coins. |
| Messari Charts | On-chain and fundamental crypto data, institutional-grade charts, market metrics, project research, transparency reports. |
| Glassnode Studio | On-chain analytics, blockchain metrics, market insights, network health data, institutional analytics tools. |
| CoinMarketCap Charts | Price charts, historical data, market cap rankings, coin tracking, basic technical analysis. |
| CoinGecko Charts | Crypto prices, historical charts, market data, DeFi and NFT tracking, ranking by volume and liquidity. |
| Santiment Charts | On-chain, social, and development activity metrics, sentiment analysis, crypto insights, trading signals. |
| Kraken Terminal (by Cryptowatch) | Professional-grade trading terminal, multi-exchange charts, live order books, portfolio tracking, technical analysis tools. |
| Nomics Charts | Crypto market data, historical charts, real-time price updates, transparency-focused metrics, API access for developers. |
10 Best Crypto Charts To Use
1. TradingView
TradingView is appreciated for its charts and technical analysis. It is equipped with very advanced charts that have deep customization, drawing instruments, and cutting-edge indicators for both beginner and advanced traders.
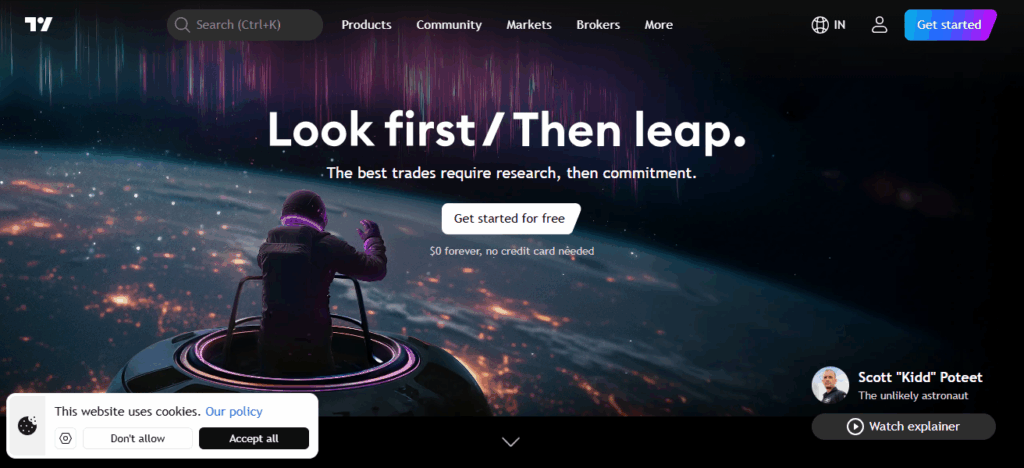
Users are Invited to a budding community where they can create alert systems, watch lists, and even collaborate on trading ideas. In addition to crypto, TradingView is multitalented salt, stocks, and forex. For day traders, the market data is real-time and it charts unbelievably fast, which is a huge boon. The platform also features the ability to create custom scripts and automate strategies with Pine Script.
| Feature | Description |
|---|---|
| Advanced Charting | Highly customizable charts with multiple indicators and drawing tools. |
| Multi-Asset Support | Tracks crypto, stocks, forex, and commodities in one platform. |
| Technical Analysis Tools | Over 100 built-in indicators and ability to create custom scripts with Pine Script. |
| Alerts & Notifications | Price and indicator alerts sent via app, email, or SMS. |
| Social Community | Share trading ideas, strategies, and collaborate with traders worldwide. |
| Real-Time Data | Fast chart updates with live market prices. |
2. Coinigy
Coinigy is a sophisticated trading platform that helps users manage charting and trading across more than 45 exchanges. Users can view price action and even trades from a single interface because Coinigy links accounts using APIs.
The platform is fully equipped with sophisticated charting tools, notifications, portfolio management systems, and a variety of historical data. Coinigy is equipped with customized layouts, market updates, and technical indicators.
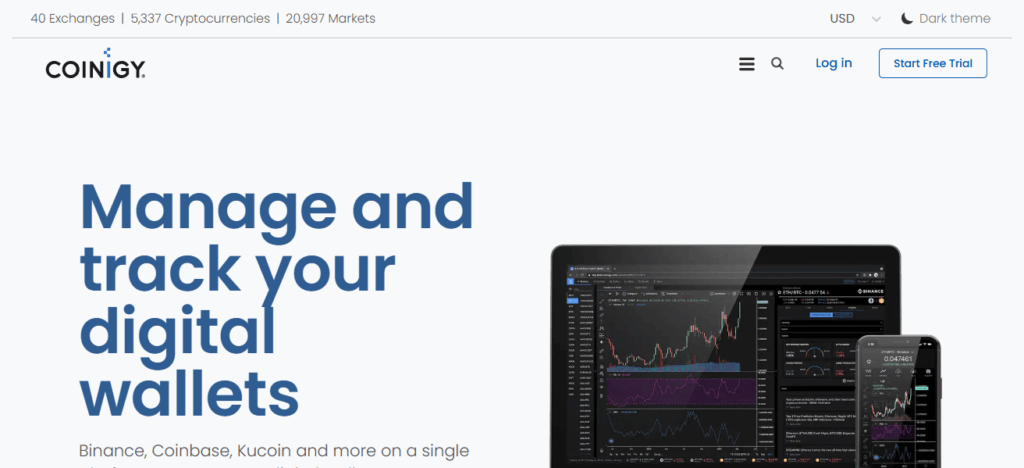
Users who have multiple accounts can rejoice because Coinigy consolidates data, facilitating easier decisions. The app works on mobile and computers and includes advanced trading features such as cross-exchange analysis, automated notifications, and sophisticated trading features that help users from easier decisions to interface with active trading systems.
| Feature | Description |
|---|---|
| Multi-Exchange Integration | Connects to 45+ exchanges for unified trading and data. |
| Portfolio Management | Track holdings across multiple exchanges in one interface. |
| Advanced Charts | Technical indicators, candlestick patterns, and customizable layouts. |
| Alerts & Notifications | Price, volume, and trend alerts for proactive trading. |
| API Access | Integrate with third-party tools and trading bots. |
| Mobile & Web Access | Trade and analyze on desktop or mobile. |
3. CryptoCompare Charts
Unlike other platforms, CryptoCompare Charts seeks to provide users with simple, yet reliable and exhaustive, market data. The site offers price charts, historical comparisons, and real-time data on a number of different cryptocurrencies.
Users can leverage vivid data visualizations to track portfolios, assess coin performance, and analyze crypto trends. CryptoCompare pulls data from a variety of exchange platforms, which helps guarantee accurate pricing and market cap data. The site also provides news, mining analytics, and other forms of social sentiment analysis to help users understand the overall market.
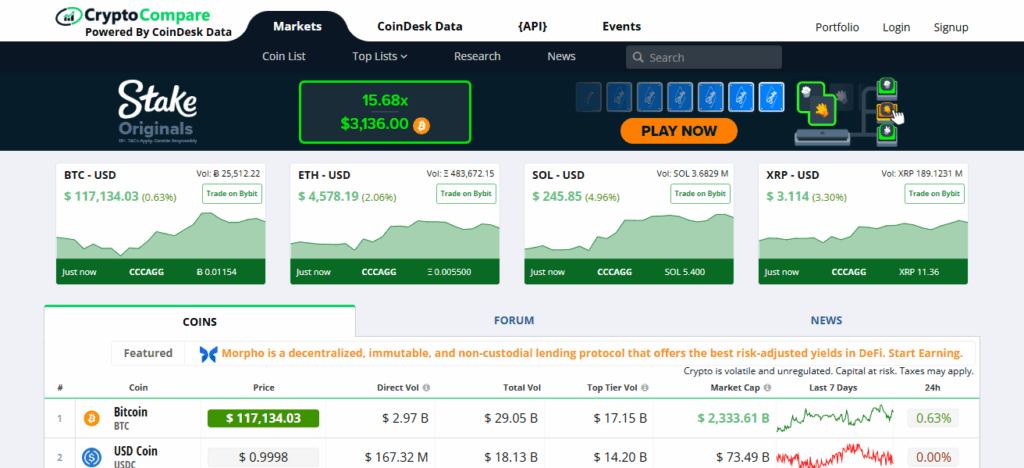
CryptoCompare is easy to use and helps even the most casual investors and data-oriented traders understand its insights. CryptoCompare helps users maintain an organized portfolio with easy comparisons to other coins for intelligent decisions within a rapidly shifting ecosystem.
| Feature | Description |
|---|---|
| Price Charts | Historical and live price data for thousands of coins. |
| Portfolio Tracking | Monitor your crypto holdings and performance. |
| Coin Comparison | Compare multiple cryptocurrencies side by side. |
| Market Overview | Provides market cap, volume, and trending coins. |
| Historical Data | Access detailed historical prices and trading data. |
| User-Friendly Interface | Intuitive layout suitable for beginners. |
4. Messari Charts
Messari Charts is focused on institutional traders and researchers who are looking for premium quality crypto data. The platform offers proprietary advanced charts on on-chain data, market analytics, and other fundamentals. Users can utilize specific research for any project, transparency reports, and in-depth historical data to assess performance and risk of a crypto asset.
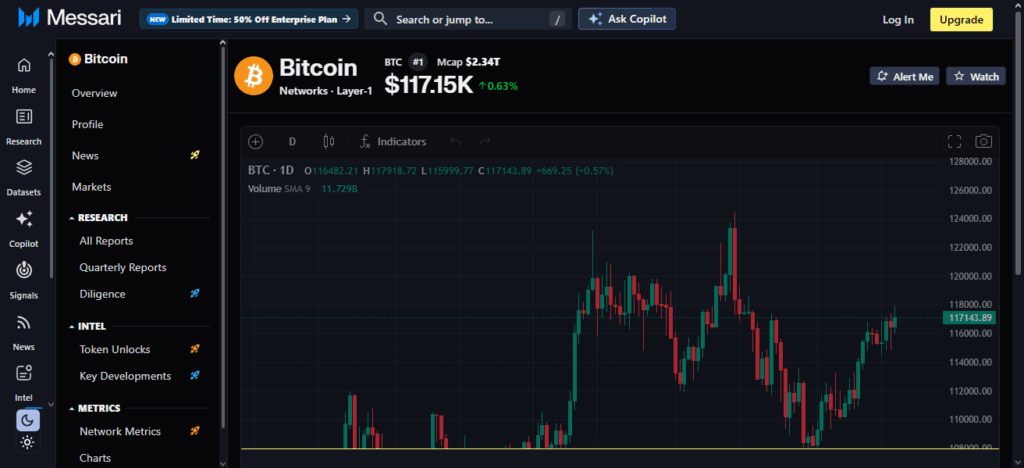
Messari is known for combining market data with blockchain insights, helping users understand activity and adoption. The charts are very interactive and users can customize and tailor their own indicators, comparisons, and metrics. This makes Messari a favorable option for professionals in investing and analytics, and crypto in general, that are in need of in-depth data and analytics for crafting strategies and investment decisions.
| Feature | Description |
|---|---|
| Institutional-Grade Data | Reliable, high-quality market and on-chain data. |
| Project Research | Coin metrics, transparency reports, and deep analysis. |
| Customizable Charts | Interactive charts with technical indicators and comparisons. |
| On-Chain Metrics | Track network activity and adoption for projects. |
| Historical Data | Access deep historical market and blockchain data. |
| Analytical Tools | Ideal for professional investors and analysts. |
5. Glassnode Studio
Glassnode Studio is a software for blockchain onchain research. It studies several data points, such as transaction counts, network participation, wallet and capital flows, and other activities. It assesses market liquidity, analyzes market health, picks trends and signals, and performs other onchain analyses.
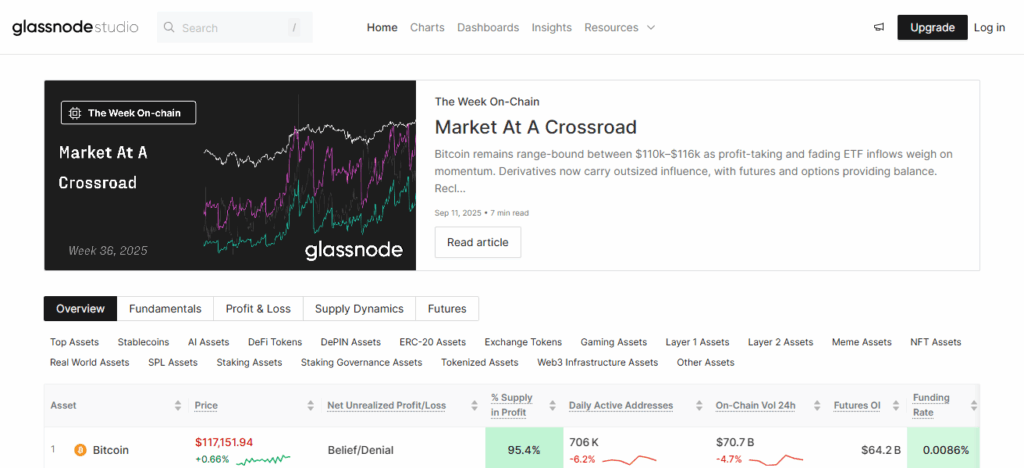
It is most beneficial for professionals and institutions as it offers more data-oriented analytic tools besides usual price charts and comparable graphic data. Glassnode provides thorough historical data along with real-time analytics, enabling effective network understanding along with sophisticated customized dashboard options and data visualizations. Therefore, it is a very powerful software for crypto research.
| Feature | Description |
|---|---|
| On-Chain Analytics | Metrics like transaction volume, active addresses, and liquidity. |
| Network Insights | Assess blockchain health and activity trends. |
| Real-Time Data | Live on-chain metrics and alerts. |
| Interactive Charts | Visualize complex blockchain data easily. |
| Custom Dashboards | Personalize views for specific coins or metrics. |
| Professional Use | Suitable for traders, analysts, and institutions. |
6. CoinMarketCap Charts
The CoinMarketCap Charts feature is really easy to use. Users get simple functionality like historical market cap ranking and price charts, alongside tracking the performance of coins. They conduct market analysis by combining data from all the hundreds of exchanges and assets to provide data from the entire cryptocurrency market. Users get the ability to compare different assets, analyze trends in coins, and manage their portfolio.
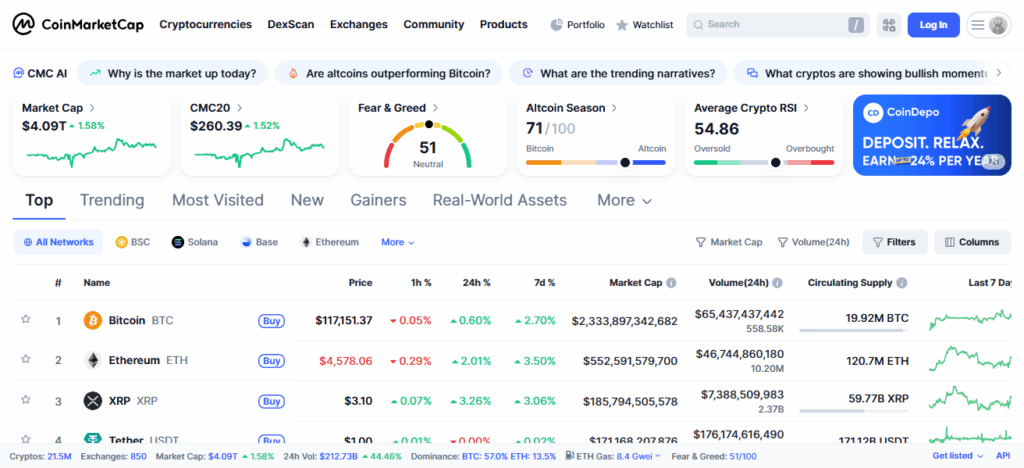
The platform incorporates basic technical analysis like candlestick charts and simple market indicators. Because of its friendly design, CoinMarketCap is perfect for people who are new to investing in cryptocurrency. The data it brings is correct and the platform is easy to use. The merging of market data with coin profiles and news makes the platform perfect for every investor.
| Feature | Description |
|---|---|
| Price Tracking | Real-time crypto prices across multiple exchanges. |
| Market Cap Rankings | See top cryptocurrencies by market capitalization. |
| Historical Charts | Analyze past price and volume trends. |
| Portfolio Tracking | Track coins and manage investments. |
| Simple Technical Tools | Basic charting and candlestick analysis. |
| News & Updates | Integrated crypto news and coin information. |
7. CoinGecko Charts
Provide overviews of different cryptocurrency markets, some of which include, prices, trading volume, historical data, and market capitalizations. It monitors on thousands of coins, DeFi tokens, and NFTs over numerous exchanges.
Users can analyze different coins, identify trading trends, and measure liquidity. CoinGecko provides additional insights, besides price and volume metrics, on developer activity, community engagement, and other related activity.
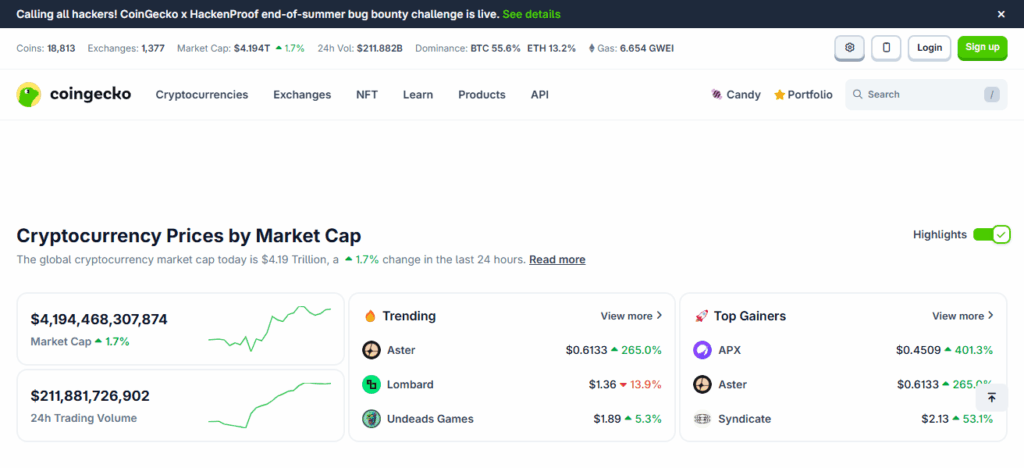
User-defined watchlists and interactive graphs help track historical performance over time. It is the go-to badge for influencers and use-case token DeFi trackers, which boast unparalleled access to market pulse and emerging ecosystem trends.
| Feature | Description |
|---|---|
| Comprehensive Coin Tracking | Thousands of cryptocurrencies and DeFi tokens. |
| Price & Volume Charts | Historical and real-time data visualizations. |
| DeFi & NFT Insights | Track tokens in DeFi projects and NFT markets. |
| Community & Developer Metrics | Activity and engagement analysis. |
| Comparison Tools | Compare coins by price, volume, and liquidity. |
| User-Friendly Interface | Ideal for casual and active traders. |
8. Santiment Charts
Traditionally devoid of actionable insights, Santiment combines market data augmented with social, on-chain, and development metrics to illuminate fogged crypto trends. Offering signals that standard charts ignore, the platform tracks trading activity, community sentiment, whale behavior, and developer engagement.
Users are empowered to influence real-time metrics, correlations, and historical trends to time-and-strategy optimize their trades. Santiment is particularly effective for early market signal detection, hype cycle identification, and the pulse of sentiment surrounding the market.
For its price-on-action devoid users, an uninterrupted advance edge is provided through flexible, interactive graphs and customized dashboards with trading alerts. Layering price action with additional data points is its primary goal.
| Feature | Description |
|---|---|
| On-Chain Metrics | Tracks wallet activity, trading volume, and network flow. |
| Social & Sentiment Analysis | Measures market sentiment and hype cycles. |
| Developer Activity | Insight into code commits and project development. |
| Real-Time Alerts | Get notified about significant market or social events. |
| Interactive Visualizations | Analyze complex crypto data easily. |
| Trading Signals | Early market signals for informed trading decisions. |
9. Kraken Terminal (by Cryptowatch)
Terminal Kraken, developed alongside Cryptowatch, offers traders a cross-exchange trading and charting terminal with unmatched analytical tools, real-time order book data, and interactive candlestick charts.
Users can access market data, manage multiple portfolios, and trade directly from the terminal. Portfolio analytics, custom alerts, and even API access with workshop features are available for users wanting a little bit more from Terminal Kraken.
As a result, day traders and institutional traders alike can benefit from the analytical tools and live data with instant execution. Terminal Kraken holds practicality, precision, and speed in high regard, ensuring traders and chartists have a seamless experience capturing the crypto world.
| Feature | Description |
|---|---|
| Multi-Exchange Charts | Access live charts from multiple exchanges in one terminal. |
| Real-Time Trading | Execute trades directly from the terminal interface. |
| Technical Analysis Tools | Advanced indicators, overlays, and charting options. |
| Live Order Books | Track market depth and liquidity in real time. |
| Portfolio Tracking | Monitor assets across different exchanges. |
| Customizable Layouts | Personalize interface for efficiency and workflow. |
10. Nomics Charts
Circulating clean, precise, and clear market data is the core focus of Nomics Charts. Daily volume of transactions, unique users, and tracking liquidity ratios of various crypto networks is displayed through real-time price tables, and historical price trends to assess versatility of price data.

Nomics eases the burden of manual work for developers by offering them API access for automated systems, trading bots, and coded analyses. Developers and casual users alike can benefit from their simplistic, yet comprehensive system. Nomics fast-tracks decision making through Transparent data and data updated in real-time, so users can operate in a fast-paced crypto market.
| Feature | Description |
|---|---|
| Real-Time Market Data | Accurate live prices and volume metrics. |
| Historical Trends | Explore past performance with detailed charts. |
| Transparency Ratings | Assess reliability of exchanges and pricing data. |
| API Access | Integrate with apps or automated trading tools. |
| Portfolio Tracking | Monitor holdings and performance easily. |
| Clean, Interactive Charts | Focused on clarity and usability for investors. |
Cocnlsuion
In cocnlsuion Choosing the right charting platform for crypto traders and investors is a matter of personal preference. Glassnode and Santiment offer the best on-chain and sentiment analysis, while TradingView and Coinigy lead the pack for multi-exchange trading and advanced charting.
For beginners, CoinMarketCap and CoinGecko are best, while Messari, Kraken Terminal, and Nomics provide professional-grade analytics and transparency. For each platform, crypto analysis serves a specific function.
FAQ
What is the best crypto charting platform for beginners?
CoinMarketCap and CoinGecko are user-friendly and provide clear price charts and basic analysis tools.
Which platform is ideal for advanced technical analysis?
TradingView offers advanced indicators, drawing tools, and custom scripts for professional traders.
Can I trade directly from these charting platforms?
Yes, platforms like Coinigy and Kraken Terminal allow multi-exchange trading from their interface.
Which charts provide on-chain analytics?
Glassnode Studio and Santiment track blockchain metrics, wallet activity, and network health.
Are these platforms free to use?
Many offer free access with limited features; advanced tools often require a subscription.


